
Short answer: Each candlestick shows 4 prices for a period: open, high, low and close (OHLC). The body tells you whether buyers or sellers won that period. The wicks show how far price went before being pushed back. Patterns such as the hammer, engulfing and morning star only mean something when they form at important levels such as support and resistance, and you should always wait for the candle to close before acting.
Candlestick charts are the most widely used charts among forex and gold traders, because one candle shows buying and selling pressure faster than a line chart can. But many beginners memorise dozens of pattern names and still lose money, because they use the patterns in the wrong place at the wrong time.
This guide covers reading a single candle, 15 key patterns with criteria you can check, how to combine them with support and resistance, and worked trade plans on both EUR/USD and gold.
Where candlestick charts come from
Candlestick charts began with rice trading in 18th-century Japan, and rice merchant Munehisa Homma is often credited with pioneering the idea. Steve Nison introduced them to the West in his 1991 book Japanese Candlestick Charting Techniques. Today they're the standard chart on almost every trading platform, including MT4 and MT5.
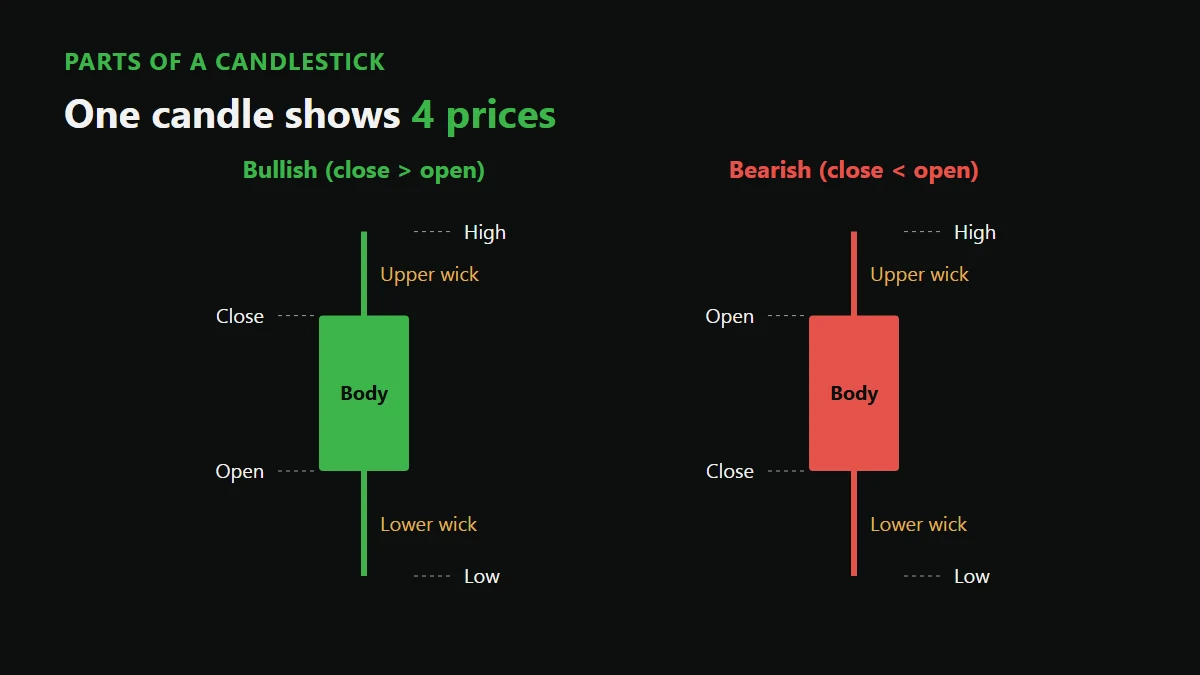
The parts of a candlestick
Part | What it is | What it tells you |
|---|---|---|
Open | The first price of the period | Where the battle between buyers and sellers started |
Close | The last price of the period | Who won by the end of the period |
Body | The range between open and close | A long body means clear pressure; a short body means indecision |
Upper wick | From the body to the high | Price went up but sellers pushed it back down |
Lower wick | From the body to the low | Price went down but buyers pushed it back up |
Colour | Bullish (close above open) / bearish (close below open) | Usually green and red, or white and black, depending on settings |
Reading one gold candle
Say a 1-hour gold (XAUUSD) candle has these prices (illustrative figures):
Open 4,050 / high 4,062 / low 4,045 / close 4,058
It closed above the open, so it's a bullish candle with an $8 body
The $5 lower wick (4,050 − 4,045) shows price was pushed down early, but buyers pushed it back
The $4 upper wick (4,062 − 4,058) shows some profit-taking near the end
Reading: buyers controlled that hour, but didn't close at the high, so buying pressure was clear but not at its strongest.
Candles and timeframes: what beginners miss
The same candle means different things on different timeframes. One D1 candle contains 24 H1 candles. A hammer on M5 carries far less weight than a hammer on H4 or D1
A candle isn't finished until it closes. A hammer you see while the candle is still forming may close as a long bearish candle. Trading before the close is guessing
The D1 close depends on your platform's server time, not midnight Thai time. Check your server time, and see the market sessions in Forex market hours
Beginners should start reading candles on H4 or D1, where there's less noise and more time to think.
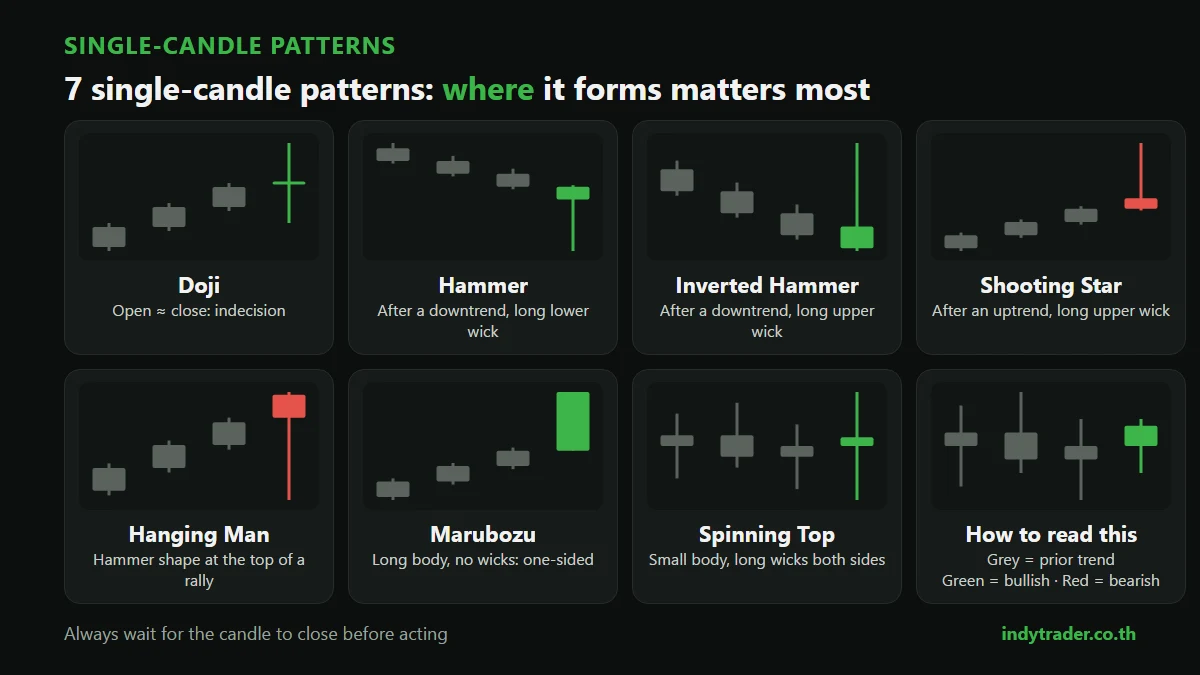
7 single-candlestick patterns
Pattern | Looks like | Where it should form | Meaning |
|---|---|---|---|
1. Doji | Open and close almost equal; very thin body | After a long trend, or at support/resistance | Indecision; the previous move is losing steam |
2. Hammer | Small body at the top, lower wick at least 2× the body, little or no upper wick | After a downtrend, at support | Buyers rejected lower prices; possible reversal up |
3. Inverted hammer | Small body at the bottom, long upper wick, short lower wick | After a downtrend, at support | Buyers testing higher; wait for confirmation |
4. Shooting star | Same shape as an inverted hammer | After an uptrend, at resistance | Sellers rejected higher prices; possible reversal down |
5. Hanging man | Same shape as a hammer | After an uptrend, at resistance | Selling pressure appearing; wait for confirmation |
6. Marubozu | Long body, almost no wicks | Anywhere; often on breakouts | One side controlled the whole period; strong momentum |
7. Spinning top | Small body, upper and lower wicks of similar length | Mid-trend or in a range | Both sides fought; nobody won |
Notice the hammer and hanging man look identical. The only difference is where they form. That's the clearest evidence that context matters more than a candle's shape.
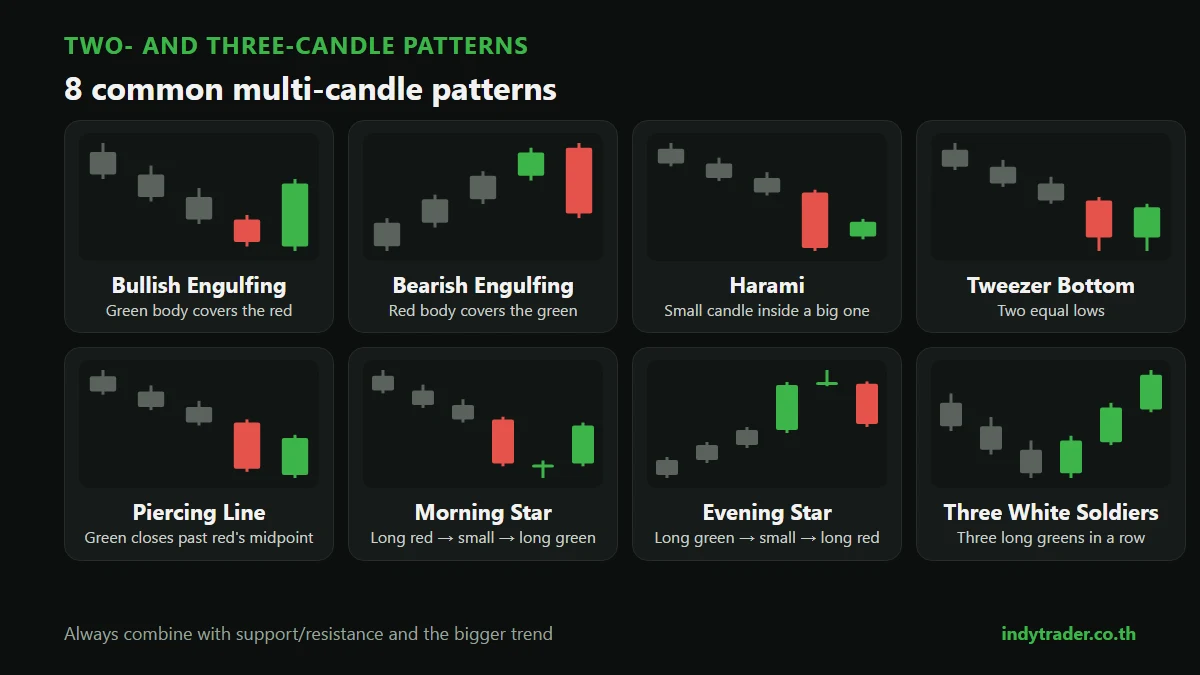
5 two-candle patterns
Pattern | Looks like | Where it should form | Meaning |
|---|---|---|---|
8. Bullish engulfing | A small bearish candle followed by a bullish candle whose body covers it completely | After a downtrend, at support | Buyers came in stronger than the previous sellers |
9. Bearish engulfing | A small bullish candle followed by a bearish candle that covers it completely | After an uptrend, at resistance | Sellers came in strongly; possible reversal down |
10. Harami | A large candle followed by a small one inside its body | After a long trend | The move is slowing; the market is hesitating |
11. Tweezer top / bottom | Two candles in a row with almost the same high (or low) | At resistance / support | Price rejected twice at the same level |
12. Piercing line / dark cloud cover | The second candle opens beyond the first, then closes past the middle of its body in the opposite direction | After a downtrend / after an uptrend | A weaker reversal signal than engulfing |
In forex, which trades continuously, a new candle usually opens at the previous close. Patterns that textbooks define with a "gap", such as the piercing line, rarely appear in their full form, so focus on the bodies and where they close.
3 three-candle patterns
Pattern | Looks like | Meaning |
|---|---|---|
13. Morning star | Long bearish candle → small candle (e.g. a doji) → long bullish candle closing past the middle of the first | Reversal up after a downtrend; fairly reliable because confirmation is built in |
14. Evening star | Long bullish candle → small candle → long bearish candle closing past the middle of the first | Reversal down after an uptrend |
15. Three white soldiers / three black crows | Three long bullish (or bearish) candles in a row, each closing near its high (low) | A new trend gaining momentum; but after a long run, it may be near exhaustion |
4 steps to use candlestick patterns properly
1. Check the trend first
A reversal pattern needs a trend to reverse. A hammer in the middle of a sideways range means nothing. Use a trendline or the highs and lows on a higher timeframe first.
2. Check that it formed at an important level
A pattern at support or resistance, a supply and demand zone, or a level where price has turned several times, carries far more weight than the same pattern in the middle of nowhere.
3. Wait for the close, and for confirmation
Always wait for the candle to close. For patterns that need confirmation, such as the inverted hammer or hanging man, wait for the next candle to close in the expected direction.
4. Plan your risk from the candle itself
Candles give clear reference points: enter above (or below) the signal candle, with the stop-loss on the other side of it. Then size the position from the stop-loss distance and your risk rule (see Lot size and Risk management).
Worked trade examples
Example 1: Hammer at EUR/USD support (H4)
EUR/USD falls to support at 1.0800, where it has turned twice before, and forms this H4 candle (illustrative figures):
Open 1.0815 / high 1.0820 / low 1.0790 / close 1.0818
3-pip body, 25-pip lower wick, 2-pip upper wick: meets the hammer criteria (lower wick many times the body)
Trade plan (30,000-baht account, 1% risk ≈ 300 baht or about $9):
Entry: buy stop above the candle's high, at 1.0822
Stop-loss: below the candle's low, at 1.0785, 37 pips away
Position size: $9 ÷ 37 pips ≈ $0.24 per pip, rounded down to 0.02 lot ($0.20 per pip). Actual risk about $7.40, or about 244 baht
Target: twice the risk, 74 pips, at about 1.0896
If price never reaches 1.0822, the order isn't triggered, which filters out hammers with no real buying behind them.
Example 2: Bearish engulfing at gold resistance (H1)
Gold rallies to a resistance level where it was sold off the day before, and forms these two candles (illustrative figures):
First candle: open 4,040, close 4,046 (small bullish)
Second candle: open 4,046, close 4,034 (bearish, body covers the first completely), high 4,049
Plan: sell when the second candle closes, stop-loss above the 4,049 high plus a little for the spread, at about 4,051, a $17 distance. At 0.01 lot of gold that's about $17, or about 560 baht of risk, so you need at least about 56,000 baht to stay within the 1% rule.
This shows something important about gold: its candles are usually longer than currency candles, so stop-losses based on the signal candle are wider too. Always check whether your capital can handle it before entering. If not, look for an entry on a lower timeframe or skip the trade. More on analysing gold in How to analyse gold prices.
7 mistakes that make candlestick reading lose money
Entering before the candle closes: a pattern seen mid-candle can always change
Using reversal patterns in the middle of a range: with no trend to reverse, the signal means nothing
Trusting very low timeframes: M1–M5 candles are noisy, especially around news
Trading against the bigger trend: an H1 hammer against a strong D1 downtrend rarely goes far
Ignoring candle size relative to its neighbours: an engulfing with a smaller-than-average body carries little weight
Forgetting the Monday open: gold and currencies can gap from Friday's close, distorting the first candle of the week
Trading candles alone without a plan: use a checklist before every trade; see the pre-trade checklist
How accurate are candlestick patterns?
There's no accuracy figure that holds across all markets. The same pattern performs differently depending on the market, timeframe and filters used. The "70–80% accurate" figures you see online rarely say how they were tested.
The best approach is to test it yourself: pick 1–2 patterns, define the conditions precisely (for example, hammers at D1 support on H4 only), then go back through at least 50–100 occurrences on the chart and record the results and the reward-to-risk ratio. How to do it: What is backtesting.
Candlesticks and other tools
Support, resistance and supply/demand zones tell you "where"; candles tell you "when"
Breakouts: a marubozu closing through resistance helps confirm the break; see breakout trading strategy
Larger chart patterns such as harmonic patterns use candles to confirm reversals at the target zone; see harmonic patterns explained
Heikin Ashi candles use averaged prices to smooth the trend, but their prices aren't real prices, so don't use them to place entries and stop-losses
Setting up candlestick charts in MT4 / MT5
MT4: press Alt + 2 to switch to candlesticks (Alt + 1 is bars, Alt + 3 is a line chart)
Press F8 to open chart properties and choose clearly different colours for bullish and bearish candles
Turn off the grid to make candles easier to read
If other chart types are new to you, read How to read forex charts.
Summary
Candlestick charts tell the story of buying and selling pressure through 4 prices. The body shows who won; the wicks show where price was rejected. Patterns such as the hammer, engulfing and morning star are useful only when they form at important levels, in line with the bigger trend, and after the candle has closed. Use candles for timing, and plan your risk from the candle every time.
Learn to read charts with Indy Trader
The Road to Trader course lays the foundations of forex trading for beginners, from basic trading principles and using MT4 to the Indy System Trade method, which helps you analyse the market with clear conditions instead of trading on emotion.
Frequently asked questions
How do you read a candlestick chart?
Look at the 4 prices of each candle: open, high, low and close. If it closed above the open it's bullish; below, it's bearish. A long body means clear pressure; a long wick means price was rejected at that level.
What does a long wick mean?
A long lower wick means price went down but buyers pushed it back up. A long upper wick means price went up but sellers pushed it back down. Long wicks at support or resistance are often meaningful signs of rejection.
Which candlestick patterns should beginners learn first?
Start with the doji, hammer / shooting star and engulfing patterns. They appear often, are easy to recognise, and can be used with support and resistance straight away. Then add the morning star and evening star.
Which timeframe is best for reading candlesticks?
Beginners should start on H4 or D1, where there's less noise and more time to analyse. With experience, look for entries on H1 or M15 while still taking the trend from the higher timeframe.
Can I trade with candlesticks alone?
It isn't recommended. Candles tell you about timing but not whether price is at an important level. Always use them with the trend, support and resistance, and your risk rules.
Are gold candlesticks different from currency candlesticks?
The reading is the same, but gold candles are usually longer, so stop-losses based on the signal candle are wider. Always size your position to your capital before entering.
Sources
Steve Nison, Japanese Candlestick Charting Techniques (New York Institute of Finance, 1991)
By the Indy Trader team. Indy Trader is a forex and gold trading academy founded in 2012 by Coach Beer (Tithivat Huayhongtong).
Risk warning: Forex and gold trading carry a high level of risk and you may lose some or all of your capital. Prices and figures in this article are illustrative only, not investment advice.
