
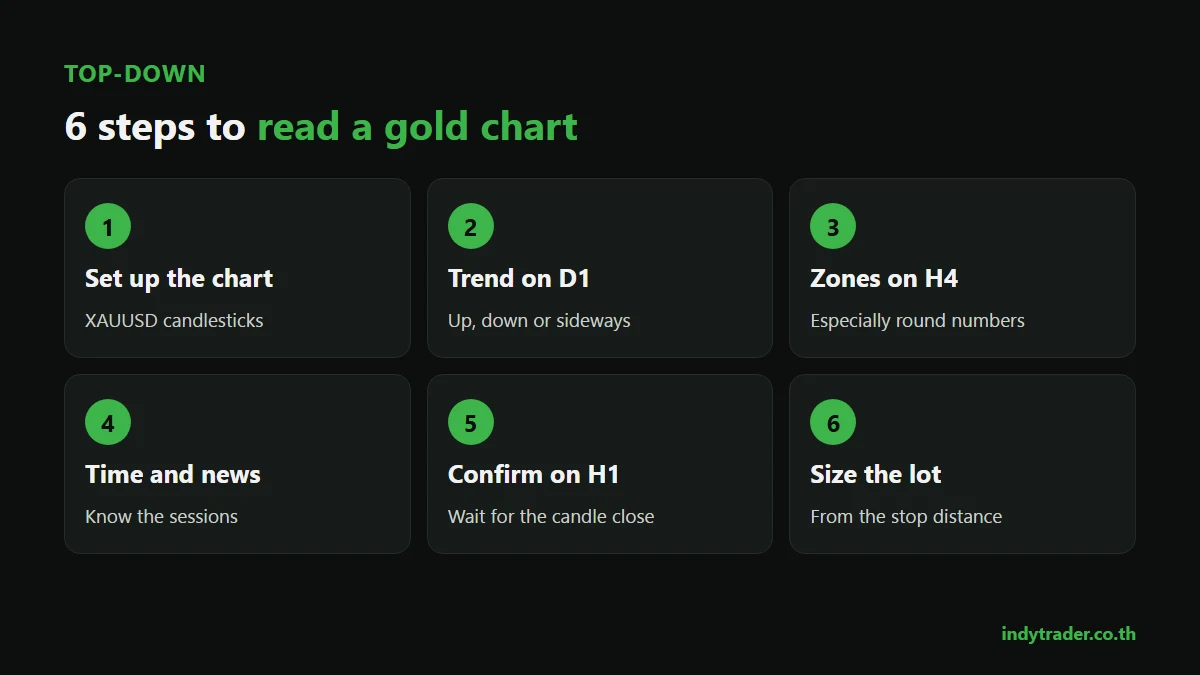
Short answer: Read a gold chart systematically in 6 steps: (1) open an XAUUSD candlestick chart, (2) read the trend on a higher timeframe (D1), (3) find support and resistance zones on H4, especially round numbers, (4) check market sessions and news, (5) wait for a confirming candle at the zone on H1, (6) calculate your lot size from the stop-loss distance before entering. Gold moves further than major currency pairs, so position size and news timing matter even more.
A gold chart looks like any currency chart, but gold has its own habits: strong moves during the London and New York sessions, sharp reactions to US news, and respect for round numbers such as 4,000 or 4,050. This guide shows beginners how to read a gold chart step by step. (If you're new to XAUUSD, read What is XAUUSD first.)
Step 1: Set up the chart correctly
Symbol: gold is usually listed as XAUUSD or GOLD; some providers add a suffix, such as XAUUSD.m
Chart type: use candlesticks, which show the open, close, high and low in each candle (see How to read candlestick charts)
Price shown: most charts show the bid. The price you can actually buy at is the ask, which is higher by the spread
Price scale: gold shows 2 decimal places, e.g. 4,012.35. A 1.00 move = $1, which is $1 profit or loss per 0.01 lot (see XAUUSD lot size)
Step 2: Find the trend on a higher timeframe (top-down)
Timeframe | Used for | Question to answer |
|---|---|---|
D1 (daily) | The big picture | Is gold in an uptrend, downtrend or range? |
H4 (4-hour) | Key zones | Where are the nearest support and resistance levels? |
H1 or M15 | Timing entries | Has price reacted at the zone yet? |
The simplest way to read the D1 trend is to look at highs and lows:
Uptrend: higher highs and higher lows
Downtrend: lower highs and lower lows
Range: price moves between a ceiling and a floor, hitting both repeatedly
You can add trendlines as explained in Trendlines. The rule for beginners: trade in the direction of D1. If D1 is an uptrend, look mainly for buys.
Step 3: Find support and resistance on H4
Gold has levels that traders worldwide watch:
Round numbers, such as 3,950 / 4,000 / 4,050 / 4,100. Gold often slows or turns around these
The previous day's and week's highs and lows
Clear previous turning points on H4 and D1
Draw zones rather than single lines; gold zones on H4 are often several dollars wide. Choose only the 2–3 zones nearest the current price (for the full method, see Support and resistance).
Step 4: Check market sessions
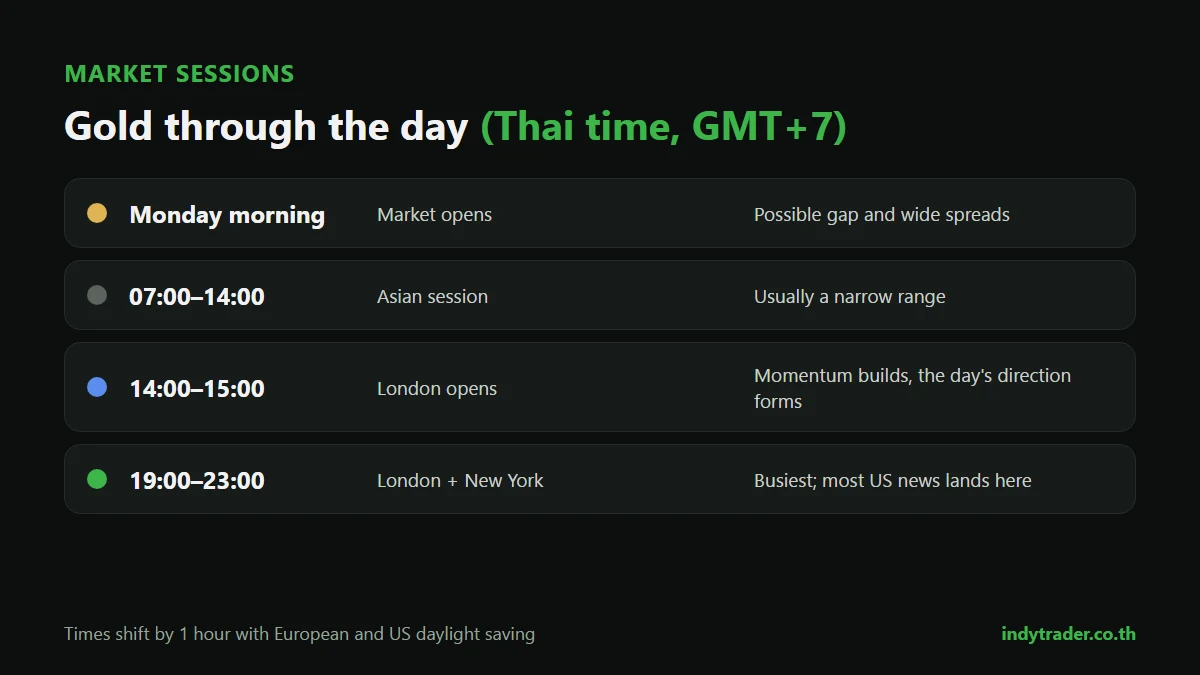
Gold doesn't move evenly through the day. Times below are Thai time (GMT+7):
Time (Thai time) | How gold behaves |
|---|---|
Monday morning, at the open | May gap from Friday's close, with wide spreads |
Asian session (about 07:00–14:00) | Usually a narrow range |
London open (about 14:00–15:00) | Momentum builds; the day's direction often forms |
London and New York overlap (about 19:00–23:00) | The busiest period; most US news is released |
After midnight | Activity fades until the early-morning break |
European and US session times shift by an hour with daylight saving. See the full timetable in Forex market hours and The best time to trade gold.
News that makes gold move sharply
US jobs data (Non-Farm Payrolls), inflation (CPI) and Federal Reserve meetings (FOMC) can swing gold by tens of dollars in minutes. Check the economic calendar before trading each day and keep an eye on the dollar (see Gold and the US dollar).
Step 5: Wait for confirmation on H1
When price reaches your zone, don't enter straight away. Wait for a reaction, such as:
A reversal candle, like a hammer or bullish engulfing at support in an uptrend
A long wick showing price was rejected from the zone
A break through the zone followed by a retest (for breakout trades)
Always wait for the candle to close. An unfinished candle can change shape at any moment, especially in gold around news.
Step 6: Calculate your risk before you click
Gold needs wider stop-losses than major pairs. The formula is:
Lot size = amount you're willing to risk ($) ÷ (stop-loss distance in $ × 100)
Place the stop-loss beyond the zone with room for the spread, and set the target at the next zone. If the distance to the next zone is less than 1.5–2 times the stop-loss, the trade may not be worth taking. Use a pre-trade checklist before sending any order.
Example: reading a gold chart through all 6 steps
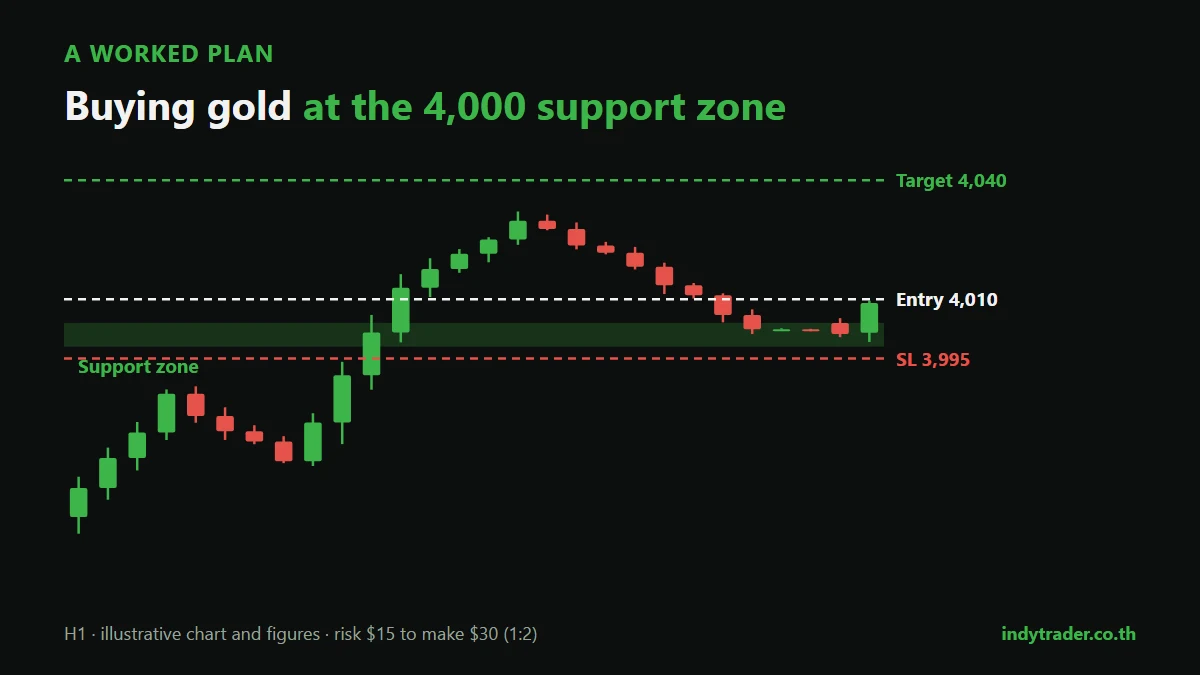
Illustrative figures:
Chart: XAUUSD candlesticks
D1: gold has made higher highs and higher lows for 3 weeks → uptrend, look for buys
H4: support zone 3,998–4,004 (the round number 4,000, and resistance that was broken earlier in the week); next resistance 4,045
Time: Wednesday 15:30 Thai time, London is open, no major US news until Thursday night, and the dollar index is slightly weaker
H1: price dips to 4,001 and a bullish engulfing candle closes at 4,009
Risk: buy at 4,010 / stop-loss 3,995 ($15) / target 4,040 ($30 = twice the risk). A 100,000-baht account risking 1% ≈ $30 ÷ ($15 × 100) = 0.02 lot, an actual risk of $30 (about 990 baht)
If price falls to 3,995, the plan was wrong: take the loss as planned and wait for the next opportunity. Don't move the stop-loss further away.
6 beginner mistakes reading gold charts
Watching only small timeframes. Gold's M1–M5 charts are full of false signals
Trading against the D1 trend because "it's gone up a lot, it must fall"
Not checking the news and opening a trade minutes before jobs or inflation data
Using currency-sized stop-losses. Gold moves further, so stops that are too tight get hit often
Covering the chart with indicators until you can't see price
Using big lots because margin is low. Margin isn't risk; risk is the stop distance times your position size
Summary
Read gold charts systematically: the trend on D1, zones on H4 (especially round numbers), sessions and news, a confirming candle on H1, and a lot size calculated from the stop-loss every time. Repeat the same routine every day until it's a habit, and log your results to improve. If you're just starting with gold, continue with How to trade gold for beginners and How to analyse gold prices.
Practise reading gold charts with a coach
The Road to Trader course for beginners, taught by founder Coach Beer, covers forex basics, trading mindset, key terms such as pips, lots, leverage and margin, the MT4 platform and the Indy System Trade method, with access to the Indy Trader community.
Frequently asked questions
How should a beginner read a gold chart?
Open an XAUUSD candlestick chart, read the trend on D1, find support and resistance on H4, check the session and news, wait for a confirming candle on H1, then calculate your lot size from the stop-loss distance before entering.
Which timeframe is best for reading gold charts?
Use several together: D1 for the trend, H4 for key zones and H1 or M15 for entries. Beginners shouldn't start with M1 or M5.
When does gold move the most?
During the London–New York overlap, about 19:00–23:00 Thai time, and around US economic news such as jobs and inflation data.
Where can I view gold charts?
On MT4, MT5 or TradingView. Prices can differ slightly between platforms depending on the price feed, so plan from the chart of the account you actually trade.
How is the XAUUSD chart different from the Thai gold price?
XAUUSD is the world gold price in dollars per ounce, while Thai gold prices are calculated from the world price and the baht, per baht-weight of 96.5% gold, so the two don't move identically every day.
By the Indy Trader team. Indy Trader is a forex and gold trading academy founded in 2012 by Coach Beer (Tithivat Huayhongtong).
Risk warning: Gold trading carries a high level of risk and you may lose some or all of your capital. Prices and figures in this article are illustrative only and are not investment advice.
