
Short answer: Support is a price level where buying has previously stopped price from falling further; resistance is where selling has stopped it rising. Practical ways to find them: look for levels where price turned several times, round numbers, the previous day's or week's high and low, and levels that were broken and switched roles. Most importantly, treat them as zones, not single lines, and wait for price to react at the zone before entering.
Support and resistance are the first tools most traders learn and the ones professionals still use every day, because they answer the two most important questions in trading: "where should I wait to enter?" and "if I'm wrong, where do I get out?" Yet many beginners draw lines all over the chart until they can't tell which ones matter.
This article explains how support and resistance form, 6 methods that work in practice, how to tell strong levels from weak ones, and worked trade plans for both a currency pair and gold.
How support and resistance form
Price moves because of buy and sell orders. When price has turned at a level before, many traders remember it and are ready to act the same way when price returns.
Traders who missed the first move wait to buy when price comes back
Traders stuck in losing positions wait to get out at break-even
Stop-losses and pending orders cluster around the same area
Orders piled up at one level often slow price down or make it bounce there. Once the orders on one side are used up, price can break through. So support and resistance aren't walls price can't cross; they're areas to be careful around and to watch for a reaction.
6 practical ways to find support and resistance
Method | How to find it | Strength |
|---|---|---|
1. Previous turning points (swing highs / lows) | Levels where price clearly turned at least twice | High, if seen on higher timeframes |
2. Round numbers | Levels like 1.1000, 1.0800, or gold at 4,000 / 4,050 | Medium to high; many orders sit there |
3. Previous day, week or month high and low | The latest D1 and W1 highs and lows | Medium; widely used in day trading |
4. Role reversal | Broken resistance that becomes support on a pullback, and vice versa | High, if retested and held |
5. Trendlines | Through rising lows (uptrend) or falling highs (downtrend) | Medium, depending on touches; see Trendlines |
6. Fibonacci levels | 38.2%, 50% and 61.8% retracements of the previous swing | Best as confirmation alongside other methods; see What is Fibonacci |
The strongest levels are where several methods point to the same price, for example a previous turning point that lines up with a round number and a 61.8% Fibonacci level.
Think in zones, not single lines
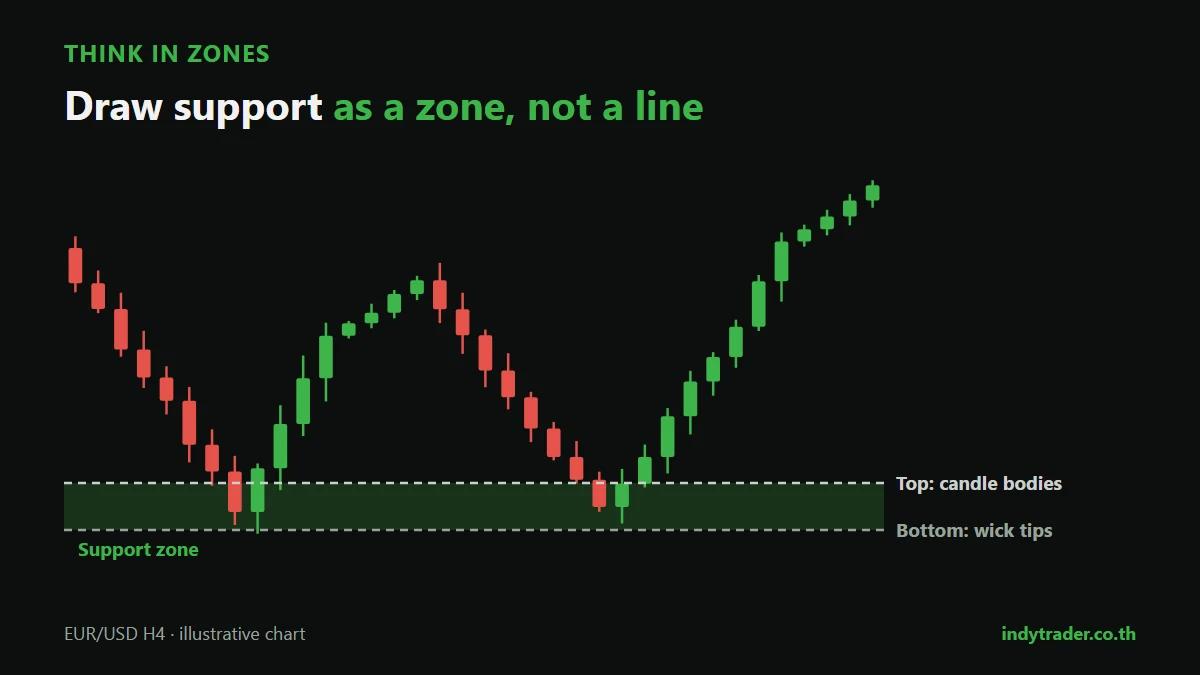
Price rarely stops exactly on a line. Sometimes it overshoots slightly; sometimes it turns before reaching it. Draw a single line and you'll hit two problems: you get stopped out even though price turned as expected, or you wait for an entry and price turns before reaching your line.
A simple way to draw a zone:
On D1 or H4, find 2–3 turning points at a similar level
Draw one line at the candle bodies (closing prices) of those points
Draw another at the wick tips
The space between is your zone
Zone width depends on the market and timeframe. Major pairs on H4 are often about 10–25 pips wide, while gold zones are often several dollars wide. The idea is close to the supply and demand zones explained in Supply and demand in forex.
Measuring the strength of a level
Factor | Strong level | Weak level |
|---|---|---|
Timeframe | Clear on D1, W1 | Only visible on M5, M15 |
Past reaction | Price bounced hard and far | Price only paused, then continued |
Number of tests | Tested 2–3 times and still holding | Hit many times in quick succession (that side is running out) |
Recency | Formed in recent weeks or months | Formed long ago, never retested |
Confluence | Matches a round number, Fibonacci or a trendline | Stands alone with nothing confirming it |
A common beginner belief is "the more tests, the stronger the level". In reality, price hitting the same level again and again often means the orders defending it are being used up, so a break becomes more likely.
Role reversal: resistance becomes support
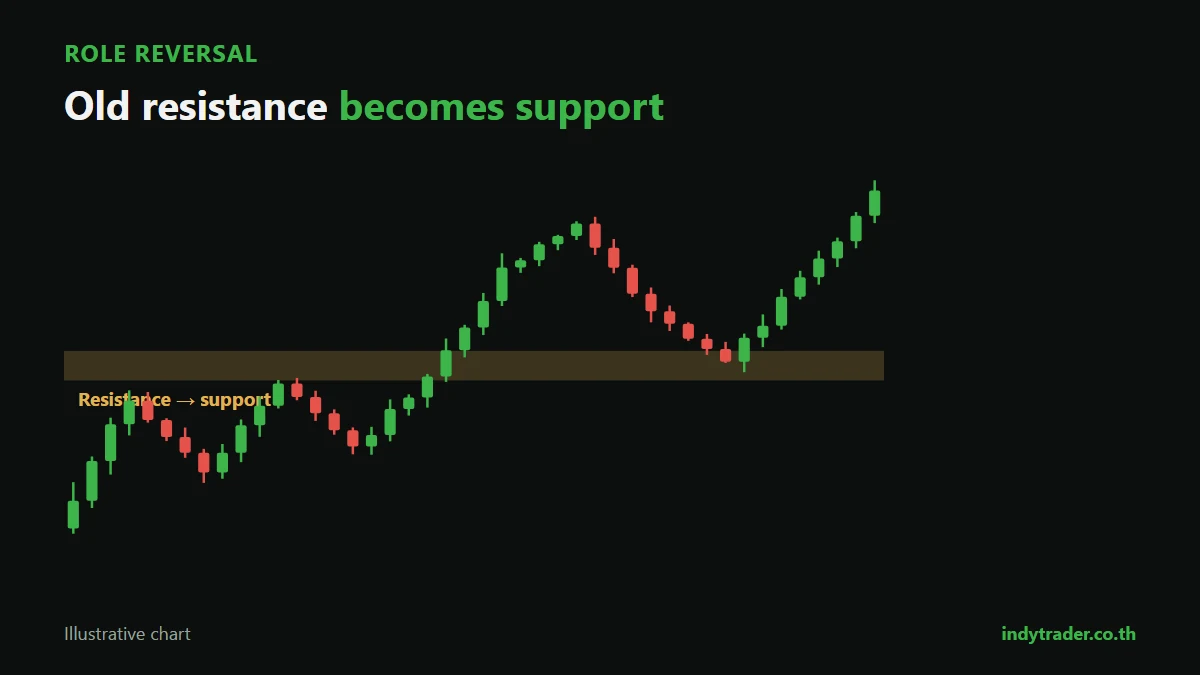
When price breaks clearly above resistance, that level often becomes support when price pulls back to test it. Traders who sold at resistance and are now losing rush to close near break-even, while those who missed the breakout wait to buy at that level.
Example: EUR/USD is held below 1.0900 for several weeks, then a D1 candle closes clearly above 1.0900. When price pulls back to around 1.0900–1.0910 and a bullish reversal candle forms, many traders look to buy there (for the full breakout strategy, see Breakout trading).
Real breakout or false breakout?
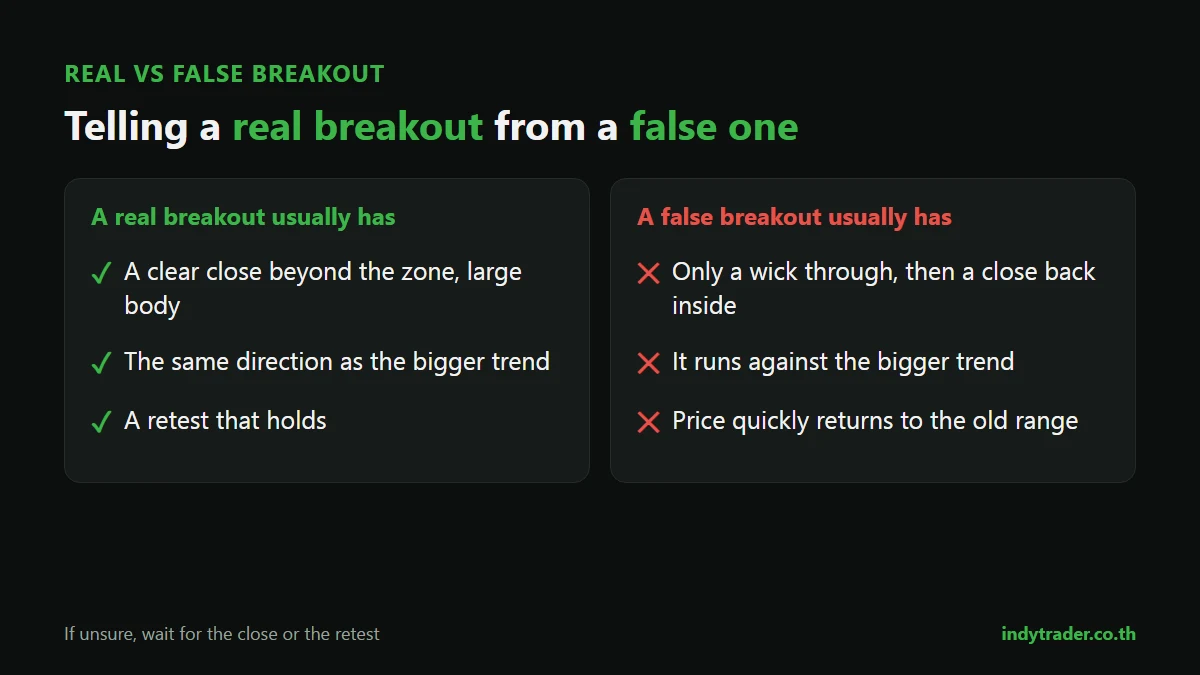
A real breakout usually has | A false breakout usually has |
|---|---|
A candle closing clearly beyond the zone, with a large body | Only a wick poking through, then a close back inside |
The same direction as the bigger trend | A move against the bigger trend |
An active session, such as London–New York | A quiet session, or a whipsaw just after news |
A retest that holds | A quick return to the old range |
If you're unsure, wait for the candle to close, or for price to retest before entering. You'll miss some trades, but you'll filter out many false breakouts.
3 ways to trade support and resistance
The bounce: buy at support or sell at resistance when a reversal candle confirms. Best in ranging markets (for candle patterns, see How to read candlestick charts)
The breakout: enter in the direction of a close through a key zone. Best when the bigger trend supports it
The retest: wait for the break, then for price to come back and test the zone, and enter in the breakout's direction. This usually gives a better reward-to-risk than entering on the break itself
Worked trade plans from support
EUR/USD (H4): a bounce from support at a round number
Support zone 1.0790–1.0805 (two turning points last month, matching the round number 1.0800)
Price reaches the zone and a hammer forms, closing at 1.0815
Entry: buy above the candle's high at 1.0820
Stop-loss: below the zone at 1.0780 (40 pips)
Target: the next resistance at 1.0900 (80 pips), a 1:2 reward-to-risk
Account 30,000 baht, risking 1% ≈ $9 ÷ 40 pips ≈ $0.23 per pip → 0.02 lot (actual risk $8 ≈ 264 baht)
Gold (XAUUSD, H1): a retest after breaking a round number
Gold breaks above resistance at 4,000 and closes clearly above it
Price pulls back to the 3,998–4,003 zone and a bullish engulfing candle forms
Entry: buy at 4,005 / stop-loss: 3,994 ($11) / first target: 4,027 (1:2)
Account 100,000 baht, risking 1% ≈ $30 ÷ ($11 × 100) ≈ 0.027 → 0.02 lot (actual risk $22 ≈ 726 baht)
Gold needs wider stop-losses than currency pairs, so calculate the lot size carefully every time (see Lot size and How to analyse gold prices).
7 beginner mistakes
Drawing too many lines. Pick only the 2–3 key zones nearest the current price
Drawing from small timeframes. Start on D1 and H4, then drop down to find entries
Using a line instead of a zone, which gets you stopped out too easily
Placing the stop-loss right at the zone edge. Leave room beyond the zone and allow for the spread
Entering the moment price touches. Wait for a reaction or a confirming candle
Fighting the bigger trend. Buying support in a strong downtrend rarely goes far
Not recording results. Test how well your method of finding levels works; see What is backtesting
Summary
Support and resistance are areas where buying or selling has changed price direction before. Find them from previous turning points, round numbers, daily and weekly highs and lows, role reversals, trendlines and Fibonacci. The best levels are where several methods overlap on a higher timeframe. Think in zones, wait for a reaction, and size every trade from the stop-loss distance. Use them with a pre-trade checklist so every trade has been thought through.
Practise finding levels with a coach
The Road to Trader course for beginners, taught by founder Coach Beer, covers forex basics, trading mindset, key terms such as pips, lots, leverage and margin, the MT4 platform and the Indy System Trade method, with access to the Indy Trader community. If you're new to charts, start with How to read forex charts.
Frequently asked questions
What are support and resistance?
Support is a level where buying has stopped price from falling further; resistance is where selling has stopped it rising. Traders use them as reference points for entries, stop-losses and targets.
How do I find support and resistance accurately?
Start on D1 or H4, find levels where price turned at least twice, then check whether they match round numbers, weekly highs and lows or Fibonacci levels. Levels where several methods overlap are usually the strongest.
Which timeframe should I use for support and resistance?
Use higher timeframes such as D1 and H4 to find key zones, then lower ones such as H1 or M15 to time entries. Levels visible only on small timeframes are usually weak.
Are gold support and resistance levels different from currencies?
The principles are the same, but gold moves further, so zones are wider and stop-losses need more room. Round numbers such as 4,000 or 4,050 often have a clear effect on gold.
What should I do when price breaks resistance?
Wait for a candle to close above the zone, then consider waiting for price to pull back and test it, as it often becomes support, before entering in the direction of the break.
By the Indy Trader team. Indy Trader is a forex and gold trading academy founded in 2012 by Coach Beer (Tithivat Huayhongtong).
Risk warning: Forex and gold trading carry a high level of risk and you may lose some or all of your capital. Prices and figures in this article are illustrative only and are not investment advice.
